Take it easy, sit back and relax
Nezha Monitoring is an open-source, lightweight server and website monitoring and operation tool. It helps users monitor server system status in real-time, including metrics like CPU, memory, disk, network, etc. Both the Nezha probe dashboard and agent can be installed via one-click scripts, supporting mainstream systems like Linux, Windows, MacOS, etc. The Nezha probe interface is clean and elegant, and supports multiple themes and languages. If you have two or more servers, it's highly recommended to use Nezha Monitoring to view server running status.
Nezha probe consists of two components:
- Dashboard: Requires a public IP, or two ports will work
- Agent: Only needs internet connection
It's very simple - one dashboard for displaying statistics, multiple agents collecting system information from their respective machines.
Since Nezha probe has been updated to v1 version with near-complete overhaul, some of the following methods may no longer apply!
1. Dashboard Deployment
The dashboard requires a Linux system
First, we obtain the login Client ID and secret.
Second, we start the installation!
Third, configure reverse proxy (optional).
1-1. Obtaining Client ID and Secret
Here we can choose to use GitHub/Gitee interface for login.
1-1-1. GitHub
Go to this link https://github.com/settings/applications/new to create an OAuth application.
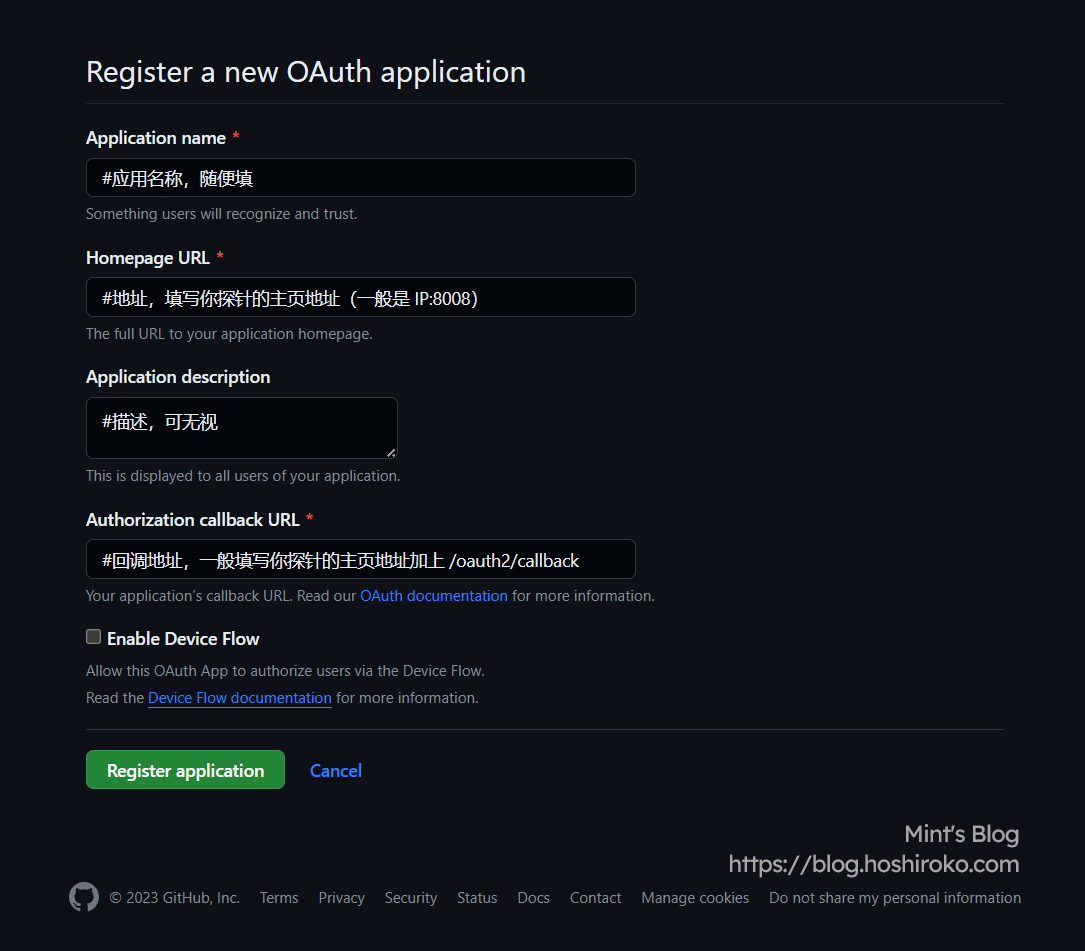
GitHub OAuth
Authorization callback URL example:
Enable Device Flow is optional.
After setting up, click Register application to complete.
Now we can see the Client ID.
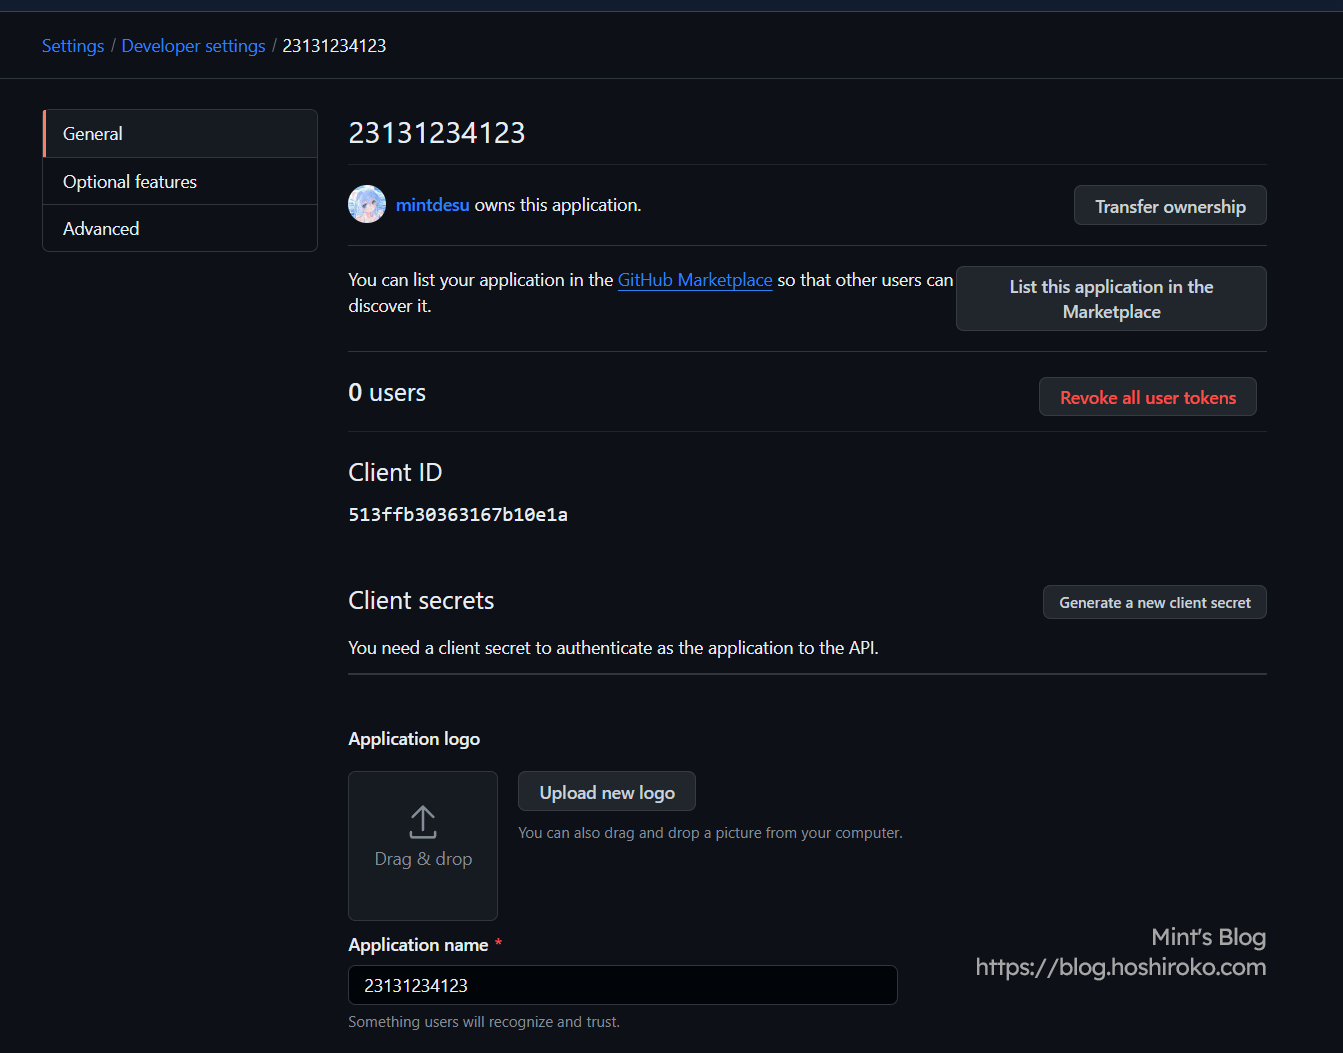
Client ID
But there's no secret yet. Click Generate a new client secret on the right side of the Client secrets row to create a new secret.
Save the Client ID and Client secrets for later use. Now you can skip to 1-2 Install Dashboard.
1-1-2. Gitee
Gitee is a good software project hosting platform in China. If you find accessing GitHub slow from China, you can use the Gitee interface.
Go to this link https://gitee.com/oauth/applications/new to create an OAuth application.
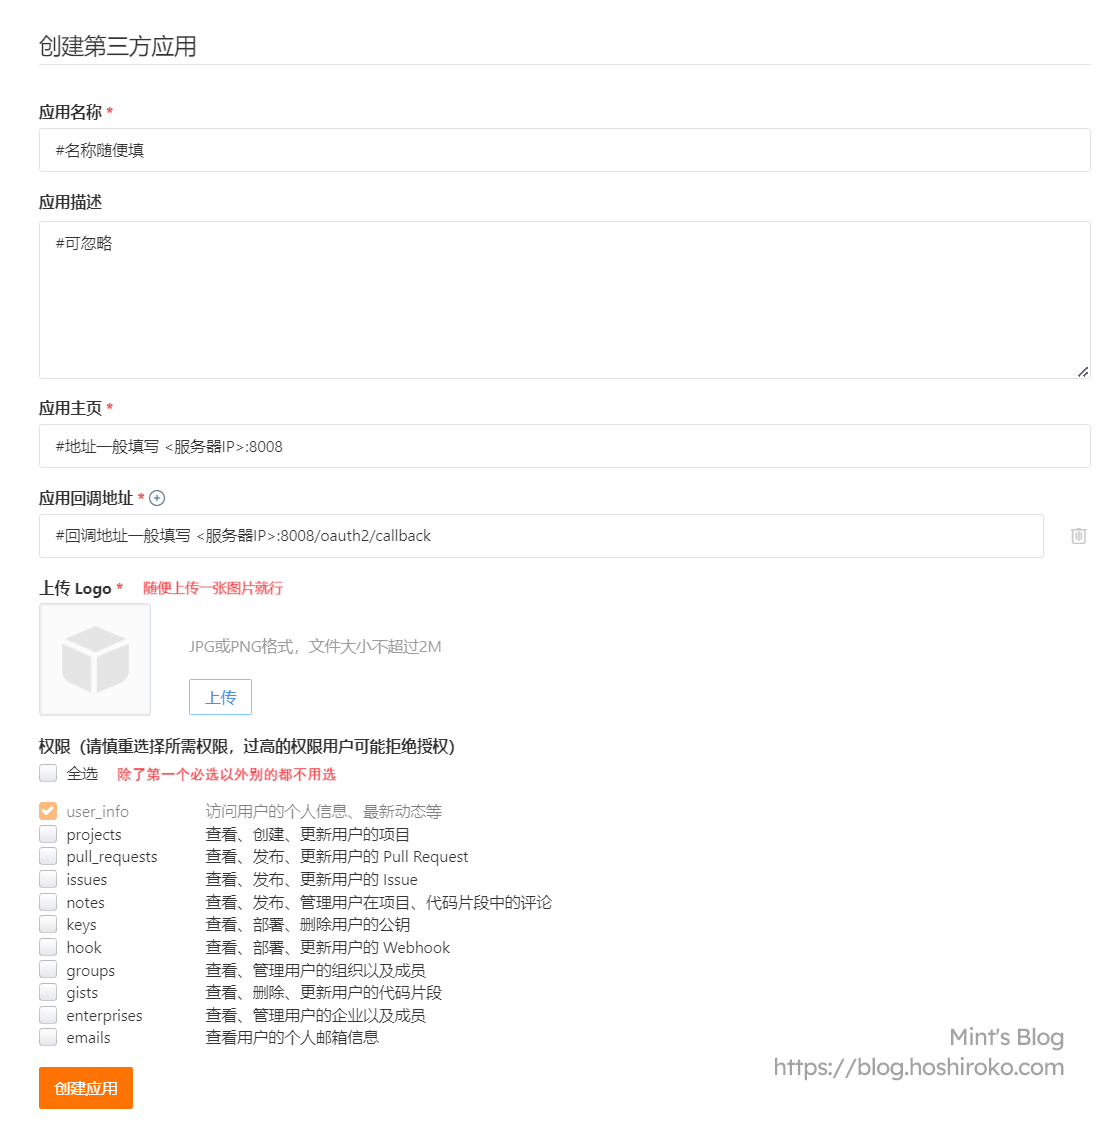
Gitee
Callback URL example:
After creating the application, we can see the Client ID and Client Secret. Save them for later use.
1-2. Installing the Dashboard
Very simple, it's an automated script.
GitHub source:
Gitee source:
Any installation method works, Docker is recommended (I don't know why I couldn't install it standalone, had to use Docker).
After entering the script, press 1 to install the dashboard.
- For OAuth2 provider, select the one you just created and press Enter
- Enter Client ID and press Enter
- Enter Client secrets and press Enter
- For administrator, enter your username from the corresponding provider, not your display name
- Site title is customizable
- Site port defaults to 8008 (recommended to keep default, you can set up reverse proxy later)
- Agent RPC port is the port for probe connection to dashboard (recommended default 5555)
Once the image is pulled, installation is complete.
1-3. Dashboard Reverse Proxy
Since the Nezha probe dashboard relies on WebSocket, remember to enable WebSocket when configuring the reverse proxy.
Here's a brief explanation:
- Open BT Panel
- Create a site
- Enter the domain and select Pure Static for PHP version
- Configure SSL certificate
- Configure reverse proxy with target URL
http://localhost:8008, disable all caching - Edit the reverse proxy configuration file and add the following to the config file
Example:
- Click save and you can access via domain. Don't forget to add DNS records
- After setting up reverse proxy, please return to GitHub/Gitee login interface to modify the homepage URL and callback URL
At this point, the dashboard is fully set up. Now let's deploy the agent.
2. Agent Deployment
Go to the dashboard backend to add a new server, then copy the secret (AgentKey) for later use.
2-1. Deploying on Windows
Here we use nssm to deploy the agent (just like frp, nssm is so useful)
On the controlled machine, download nssm and agent (If you can't access the nssm website or GitHub, you can use the mirror provided by this site: nssm, agent)
Generally, download nezha-agent_windows_amd64.zip.
After extracting nssm, find nssm.exe in win64/32 and place it in any directory. Also extract the agent to this directory, open cmd, cd to this directory, and execute the following command:
A window will pop up.
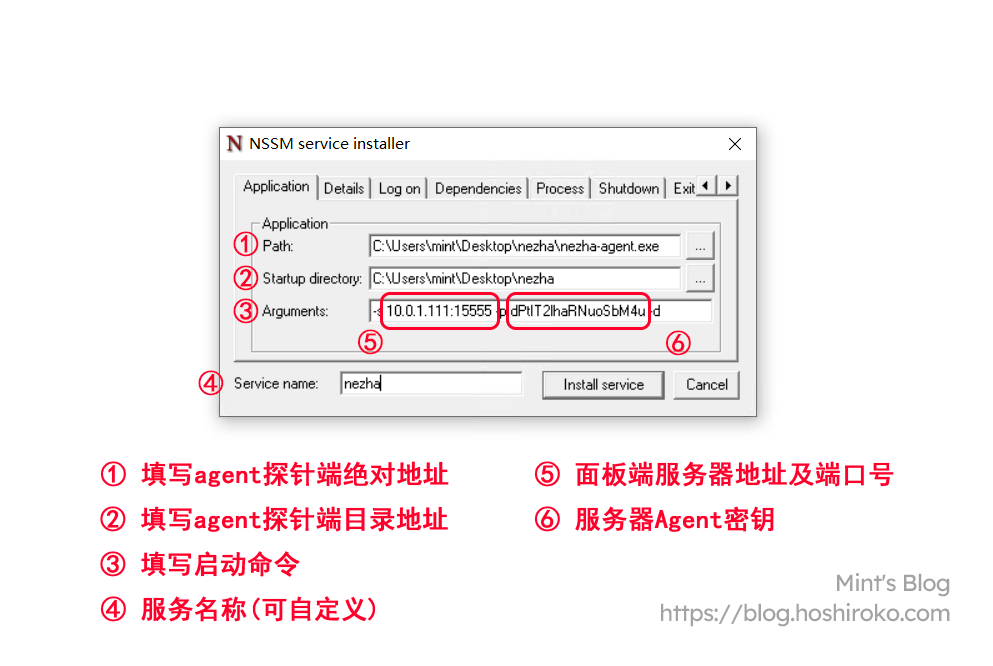
nssm
Startup command template:
Startup command example:
After clicking Install service, find the service we created in Task Manager and start it.
After a while, you can see the server come online. The first initialization will be slower.
(This "a while" could be 1-10min, or possibly 1-2h)
2-2. Deploying on Linux
Script Installation
Linux is much simpler than Windows. No need to download third-party programs, just use the official installation script.
You can use the one-click installation from the dashboard backend, but that uses GitHub, which is difficult to connect from China.
GitHub source:
Gitee source:
- Enter the dashboard IP or domain, cannot use CDN
- Enter the dashboard Agent RPC port, default is 5555
- Enter the Agent secret
- SSL/TLS encryption can be skipped
After a while, you can see the server come online. The first initialization will be slower.
(This "a while" could be 1-10min, or possibly 1-2h)
Manual Installation
Manual installation is more troublesome, generally used for pure IPv6 machines or complex network environments.
First, determine your server's architecture. Most are x86 (amd64) architecture.
For x86 architecture, download nezha-agent_linux_amd64.zip
For arm architecture, download nezha-agent_linux_arm64.zip
After downloading, extract, upload, and cd to any directory to start:
Create a daemon process for the Agent:
Fill in the following:
Start and enable auto-start on boot:
Now everything should be working. Return to the dashboard to check.
2-3. Deploying on NAS Systems
Since I only have Synology, I'll use Synology as an example.
Download Agent (Mirror: Agent). Make sure to check your NAS's CPU architecture.
For example, my DS920+ has an Intel J4125, which is x86 architecture, so download nezha-agent_linux_amd64.zip.
Another example, my DS218Play has a Realtek RTD1296, which is arm architecture, so download nezha-agent_linux_arm64.zip.
(Personal note: don't buy arm NAS! Otherwise you'll become unfortunate!)
If you can't determine your CPU architecture, you can search online or ask GPT.
Find the corresponding architecture, download and extract, put nezha-agent in any folder, right-click Properties to view the location and save it for later.
Enable Terminal (SSH) in Control Panel, connect using any tool.
(What, you don't have an SSH tool? Just type ssh <nas admin account>@<nas IP address> in cmd and press Enter)
After connecting, type sudo -i to enter superuser (root) mode.
It will ask for your password. Don't worry, it's just your NAS login password. Enter it again.
Once in, directly enter the following command to create a system service:
Then enter the following in nezha-agent.service (the location is what you saw in Properties earlier):
Template:
Example:
Fill in according to your situation, then press esc and type :wq to save and exit.
Then enter the following command to start the Agent:
Check status (if it shows green active (running), it started successfully):
That's the complete deployment. It should be fairly simple (hopefully).
For interface customization and such, you can refer to other articles. I won't cover that here.
Some content referenced from Nezha Probe Official Documentation, Mitsea Blog